Data
- 172 features
- 84 of Top 100 rated game on Steam
- Two years historical data on SteamDB
- About 40000 rows
- Spilt ratio of training data and testing data is 4 : 1
- We used 20 months data for training and 4 months data to evaluate our predictor.
Some Baselines
To demonstrate our model’s performance, here are some common baselines:
- Random Guess :
- Blind guessing
- Naive method :
- Use the average discount gap of a game as a threshold. If a instance have cross this threshold predict it as “Don’t buy”, otherwise “Buy it”.
Reasonable Metric
Treat “Caution” as “Don’t buy”, which means if a instance’s ground truth is “Don’t buy”, we predict “Caution” is a correct prediction.
Experiment Result
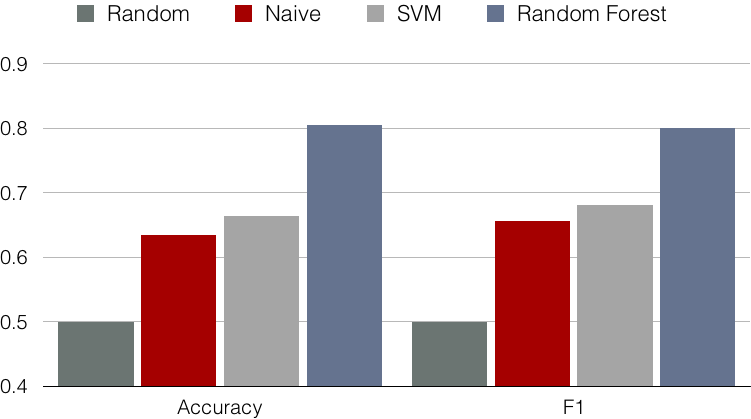
We use two popular classifiers : 1) SVM, 2) Random Forest in our experiment. We can see Random Forest outperformed others and achieved over 80% accuracy and F-score. It’s interesting to point out that one of our baselines “naive method” actually perform surprisedly well and result is just a little behind the SVM. Here, we concluded some comparison between SVM and Random Forest in this Steam dataset.
- Random Forest is much more robust
- Grid Search in Random Forest is much faster : About 20 times
- Random forest interpretation : Give us further information on feature selection